Gaming Mods Come to Analytics
Mods is a new framework that lets you modify TIBCO Spotfire to make it your own. We stole the idea from gaming Mods, which allows developers to add worlds, players, and landscapes to their favorite game. It’s like legos, but way better. This week we’re hosting our first public “Modathon" to help developers create their own Mods.
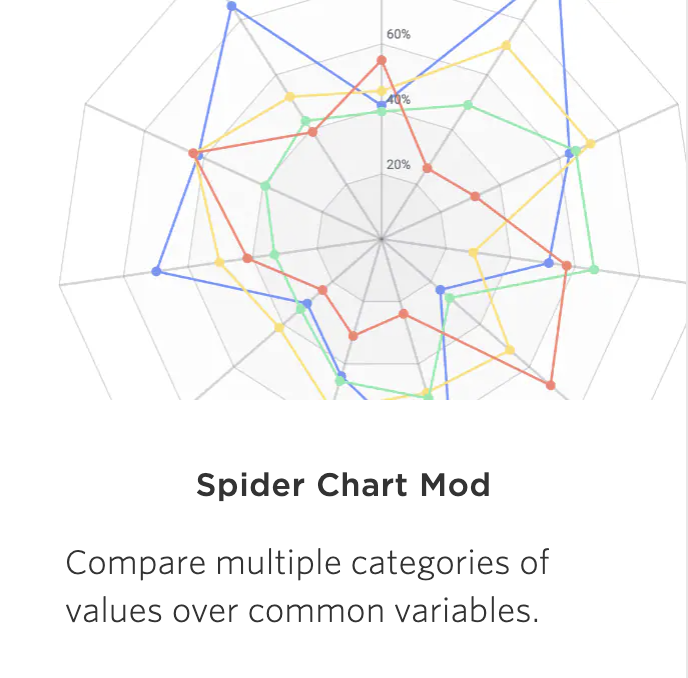
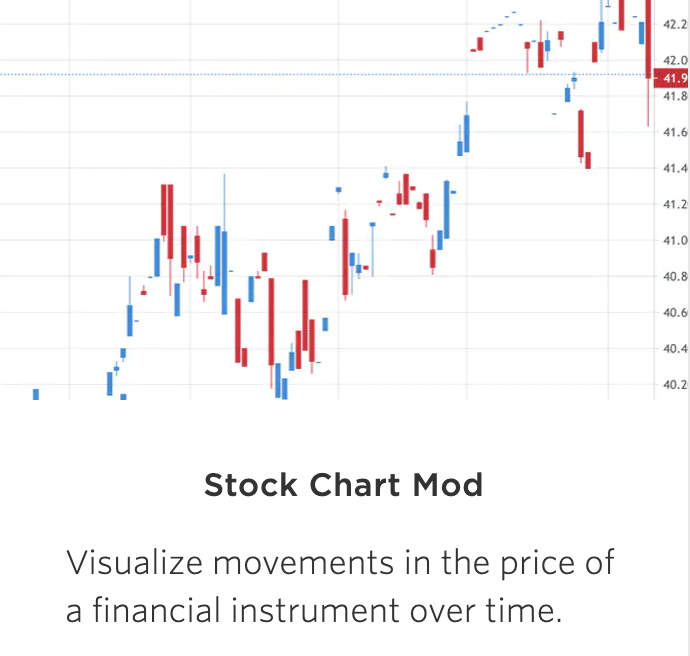
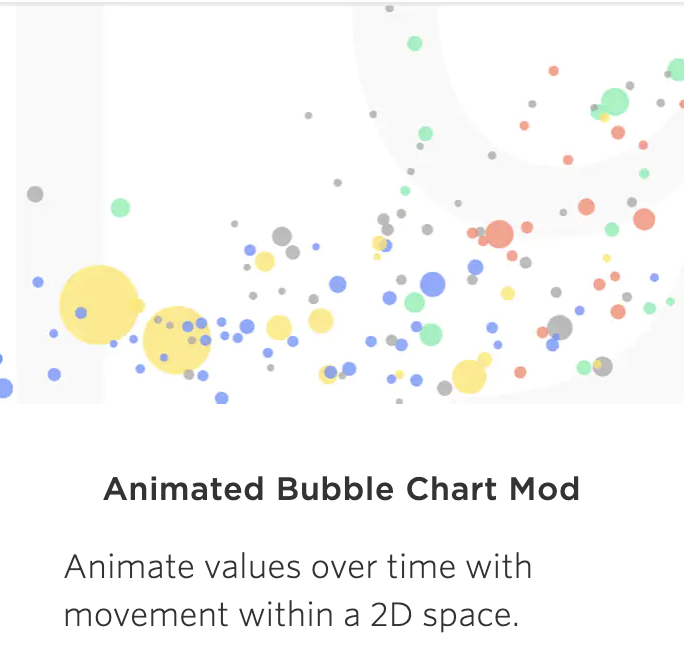
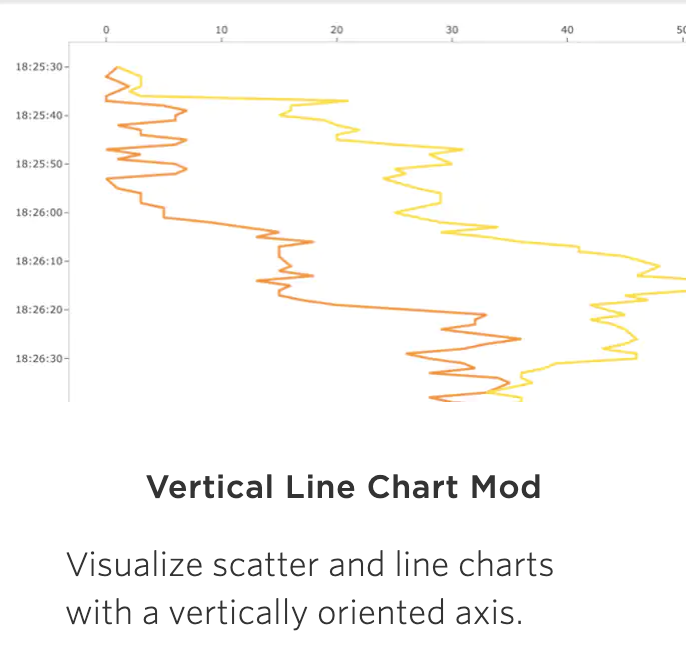
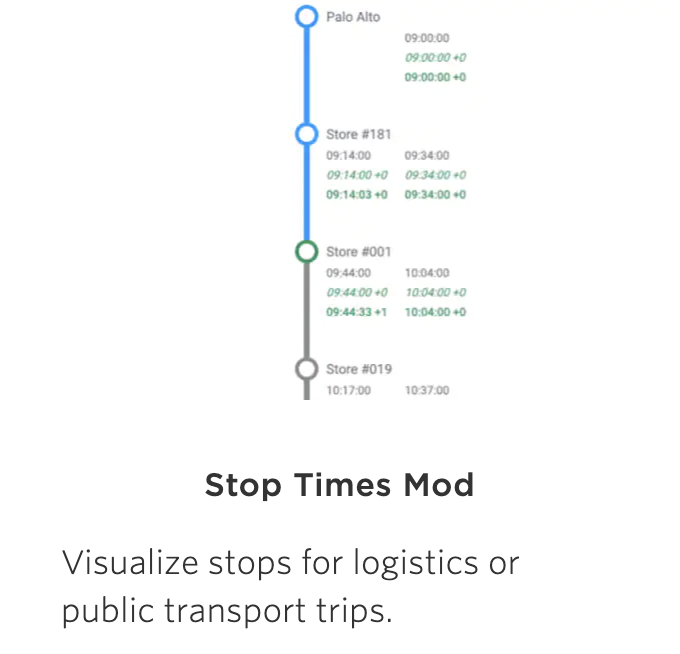
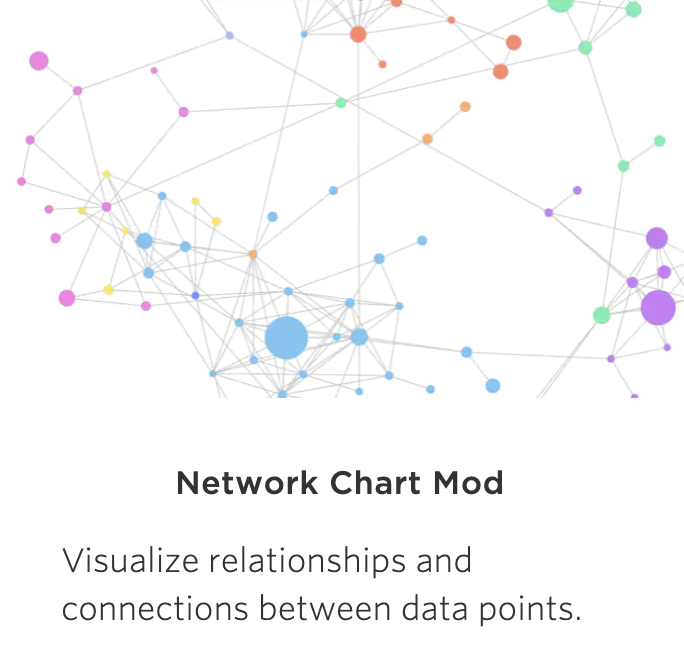
Mods are like mini analytics applications that let any business user morph analytics experience in seconds. I use them to blog! The Bubble Chart Animation Mod shows COVID vaccinations and re-infections, the Stop Chart Mod shows a real-time view of buses, taxis, and trains for Smart City applications, and the Spider Chart Mod is a great way to show data science career paths.
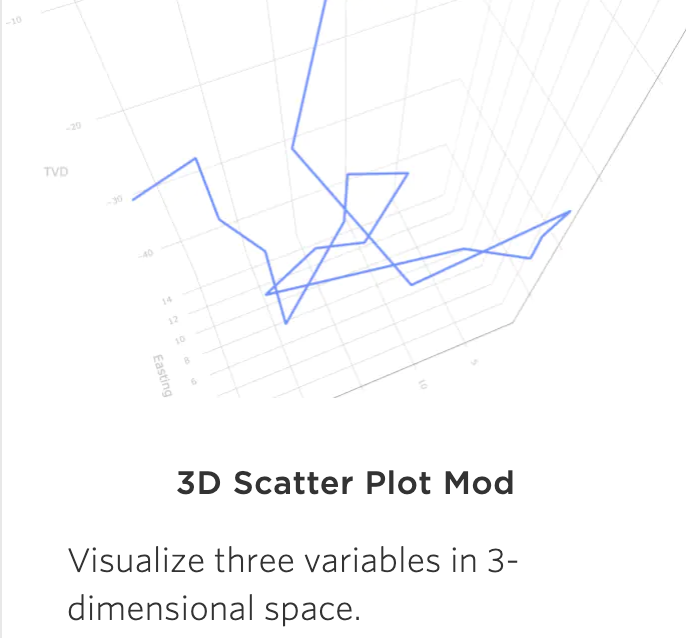
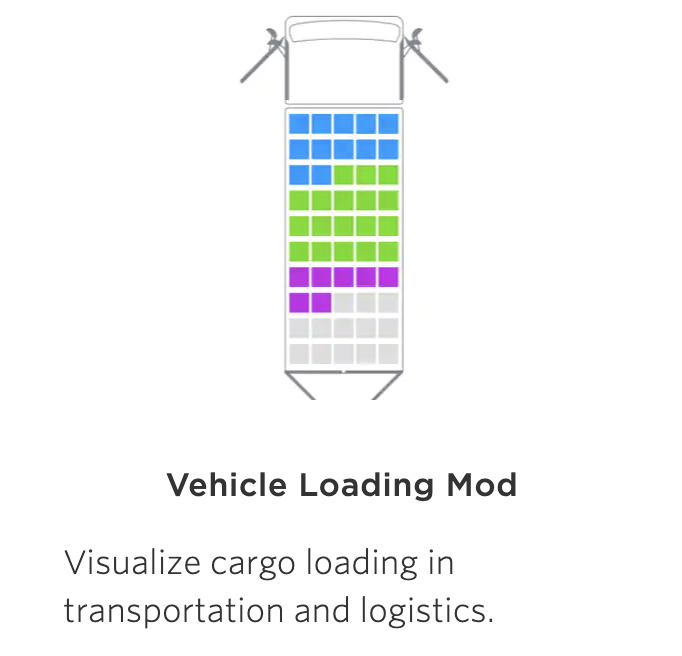
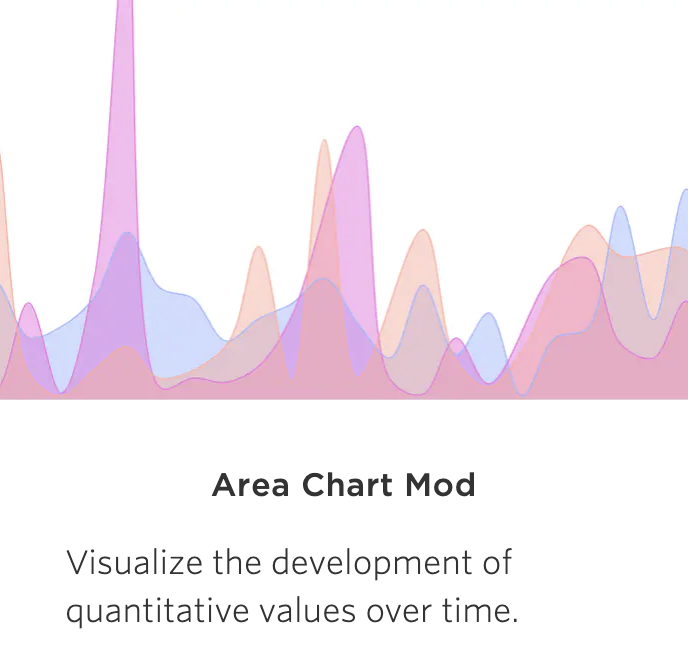
Here are some of the Mods that have already hit the TIBCO community and GitHub. More are on the way…
Mods are created with a very simple Javascript framework. Once developed, Mods becomes a native extension to the platform: you can combine the with other charts or Mods, access data from hundreds of data sources, from Snowflake to Excel spreadsheets, connect to real-time IoT data. It all comes for free.
During the Modathon, which is free to join, our developers will show you how to build your own Mod and hold office hours for tips and tricks.
It’s great to see innovation grow in the community through the power of collaboration. Register now or sign up to hear about future Modathons throughout the world!