
Analytics for Moving Data
In the automation era, more and more data is in motion. Here’s how any knowledge workers can harness it.
In the late 1800s, Leland Stanford hired Edward Muybridge to help him settle a bet. Stanford believed that horses leave the ground as they run; he was right. Images 2 and 3, below, show all four hooves off the ground. It took years to capture these images. Muybridge invented a new photography technique using an array of cameras with tripwires. As the horse ran by the cameras, its hooves broke wires, which released the shutter. The innovation was the forefather of motion pictures. Over a hundred years later, the revolution continues: photography and videography advances, both creatively and technologically.
Analytics is at the dawn of a similar revolution. New streaming analytics technologies help knowledge workers feel like they’re at the movies, able to peer inside automated systems, streaming data from drones, connected things, and social media. New streaming analytics technologies help knowledge workers feel like they’re at the movies. Here’s how.
The Too-Late Architecture Reigns in Corporate IT
Most of the world's IT systems today answer questions using historical data— hours, days, or weeks old. For automated robotic systems, interactive services like Uber, or social customer interaction, yesterday’s data isn’t good enough. Who cares if you learn you learn a piece of industrial equipment after it breaks? It's too late. This “too late architecture” reigns in corporate IT today.
Sensors, drones, and real-time feeds carry insight that can help avert disasters before they happen; it can help surprise and delight customers when they engage with you, and it can help manage automated systems of all types in real-time.
But you can’t manage what you can’t see. Analytics for moving data helps human knowledge workers understand real-time data and make decisions based on continuous, live insights.
Introducing Visual Analytics for Moving Data
Like Muybridge's trip-wire technique, modern real-time visual analytics help humans see what they haven’t seen before. They shine a light on automated systems and the global social fabric, not horses. And they do it at scale. Muybridge captured a few hundred images; it’s common for real-time systems to generate billion of data points a day.
The visualizations below show analytics on moving data at work. The visualization shows wind-tunnel data for a formula one race car. We see data from sensor readings, location, and speed as it streams from sensors embedded in the chassis. The colors show deviation from historical performance: green is better than our previous fastest lap; red is worse.
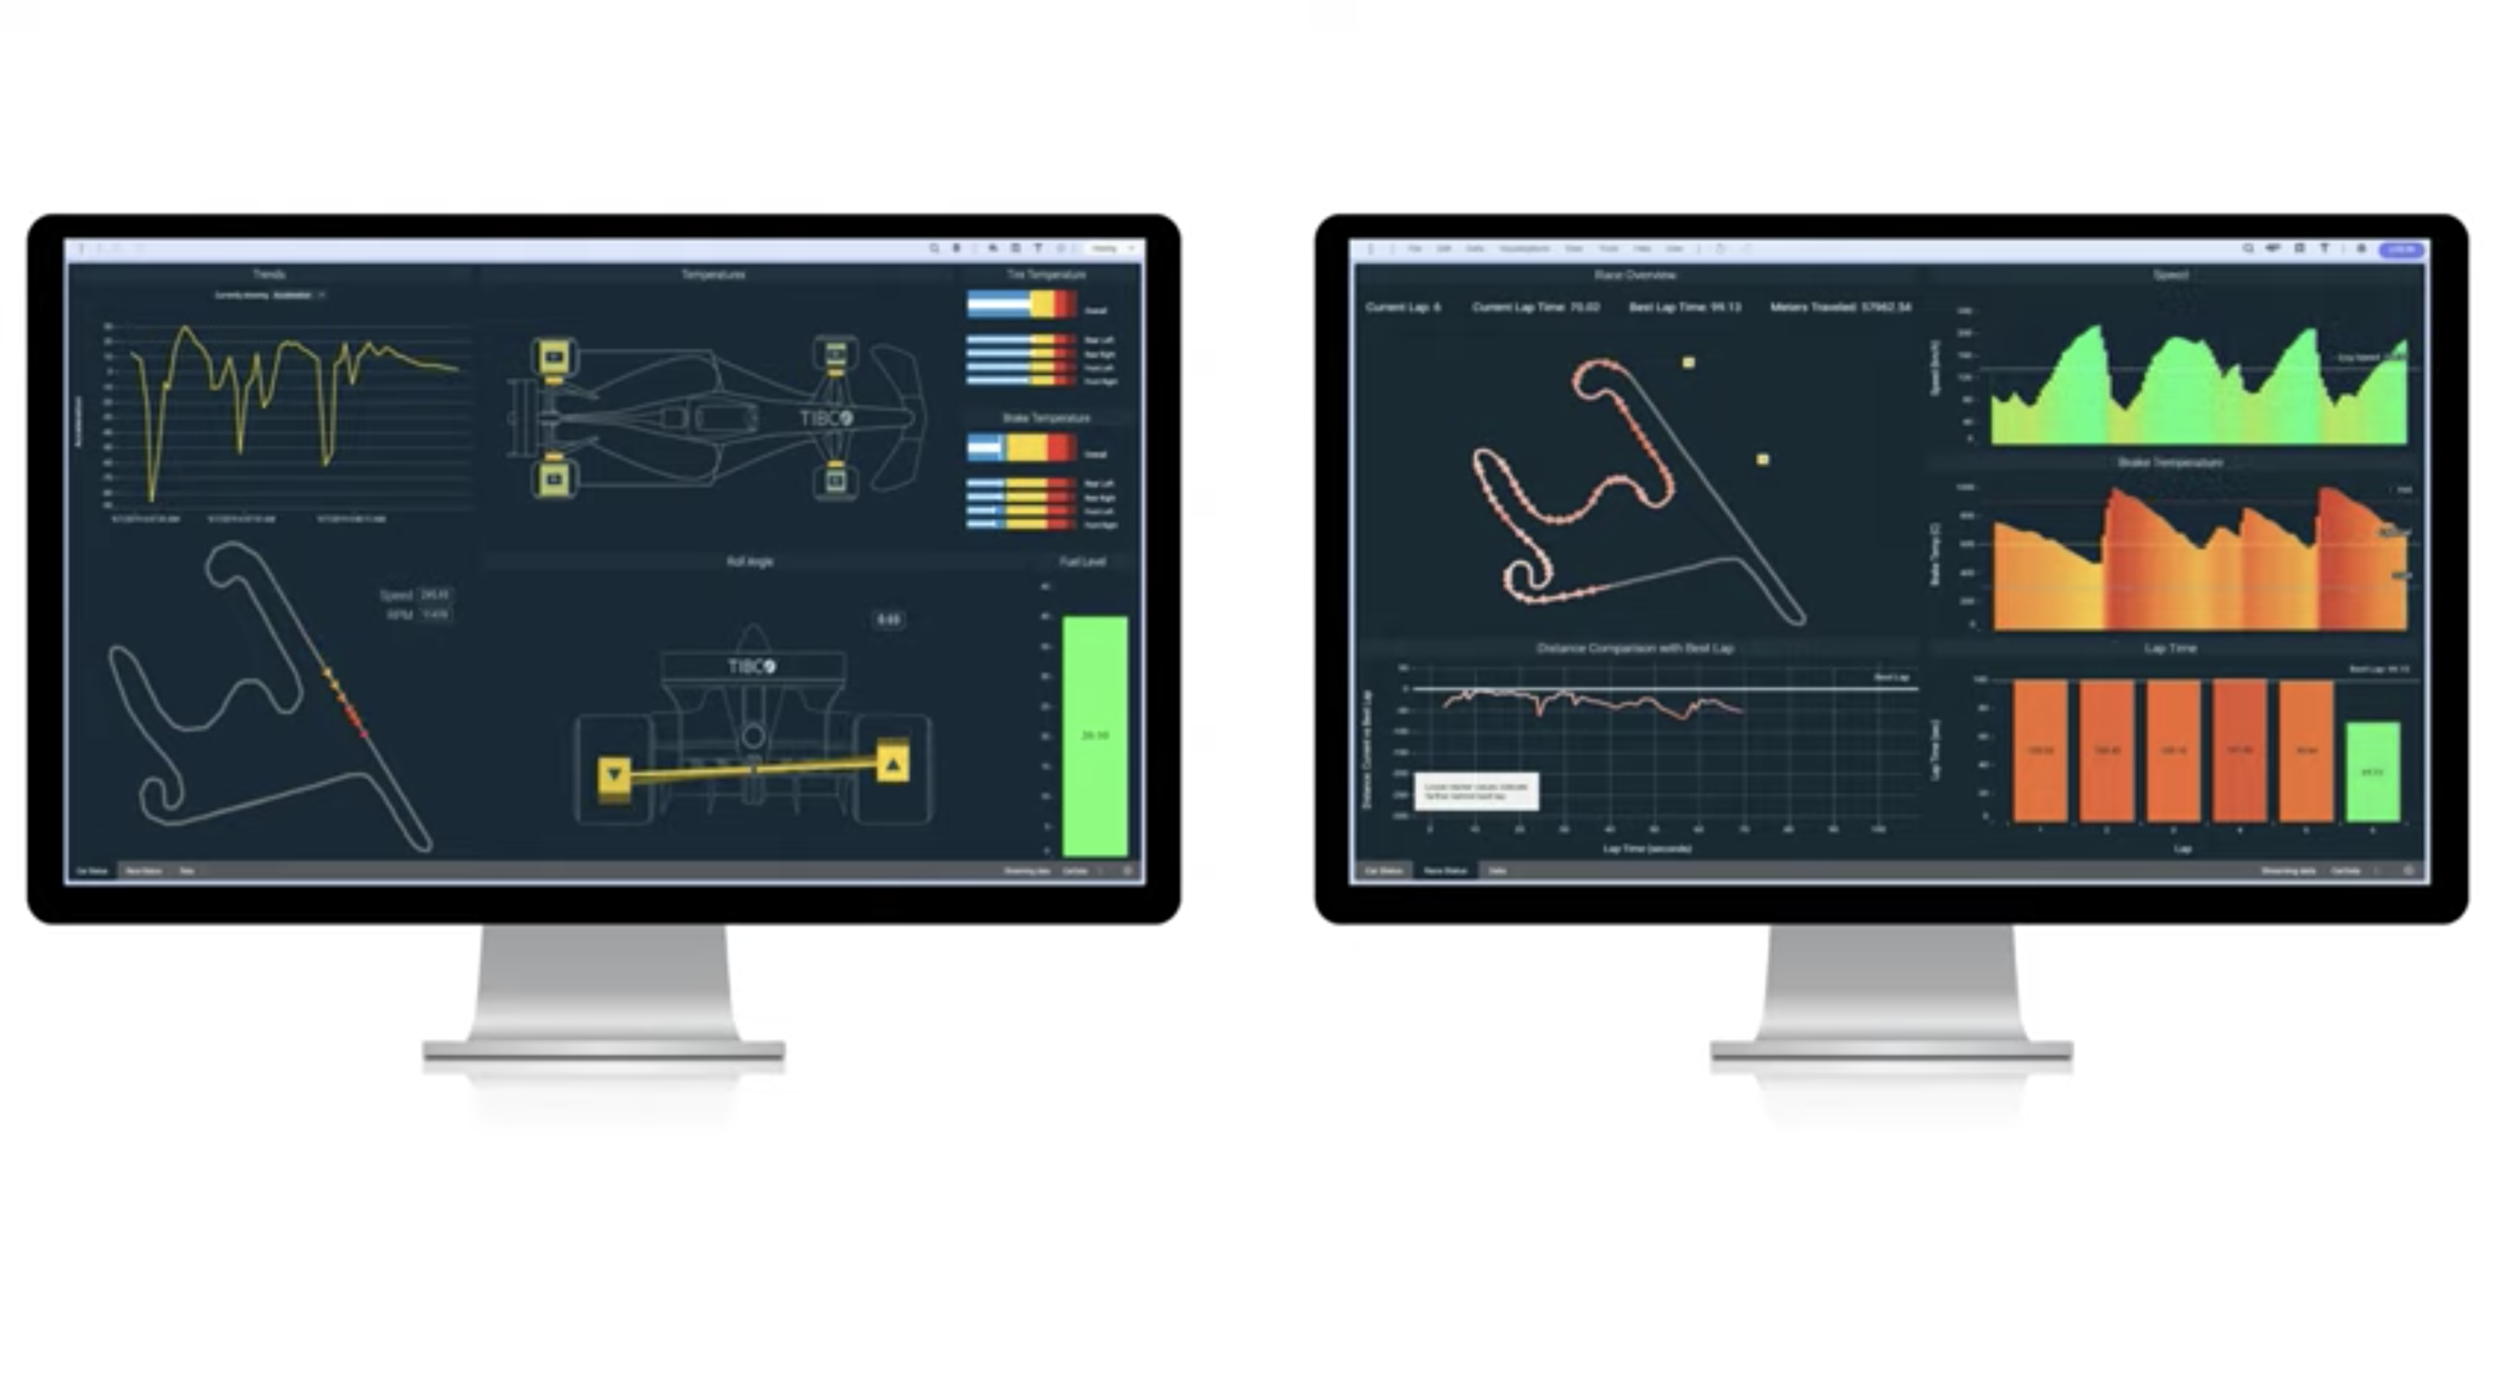
Streaming analytics helps race analysts immerse themselves in what’s happening, like how you immerse yourself in a great movie. What does this movie tell you? In this scene, we look inside the car’s behavior on its way through a turn. We see the position of the car; the sensor readings from tires that indicate their wear; the weather forecast. It’s all there to immerse the expert see what was previously unseeable.
Simplicity is the Revolution
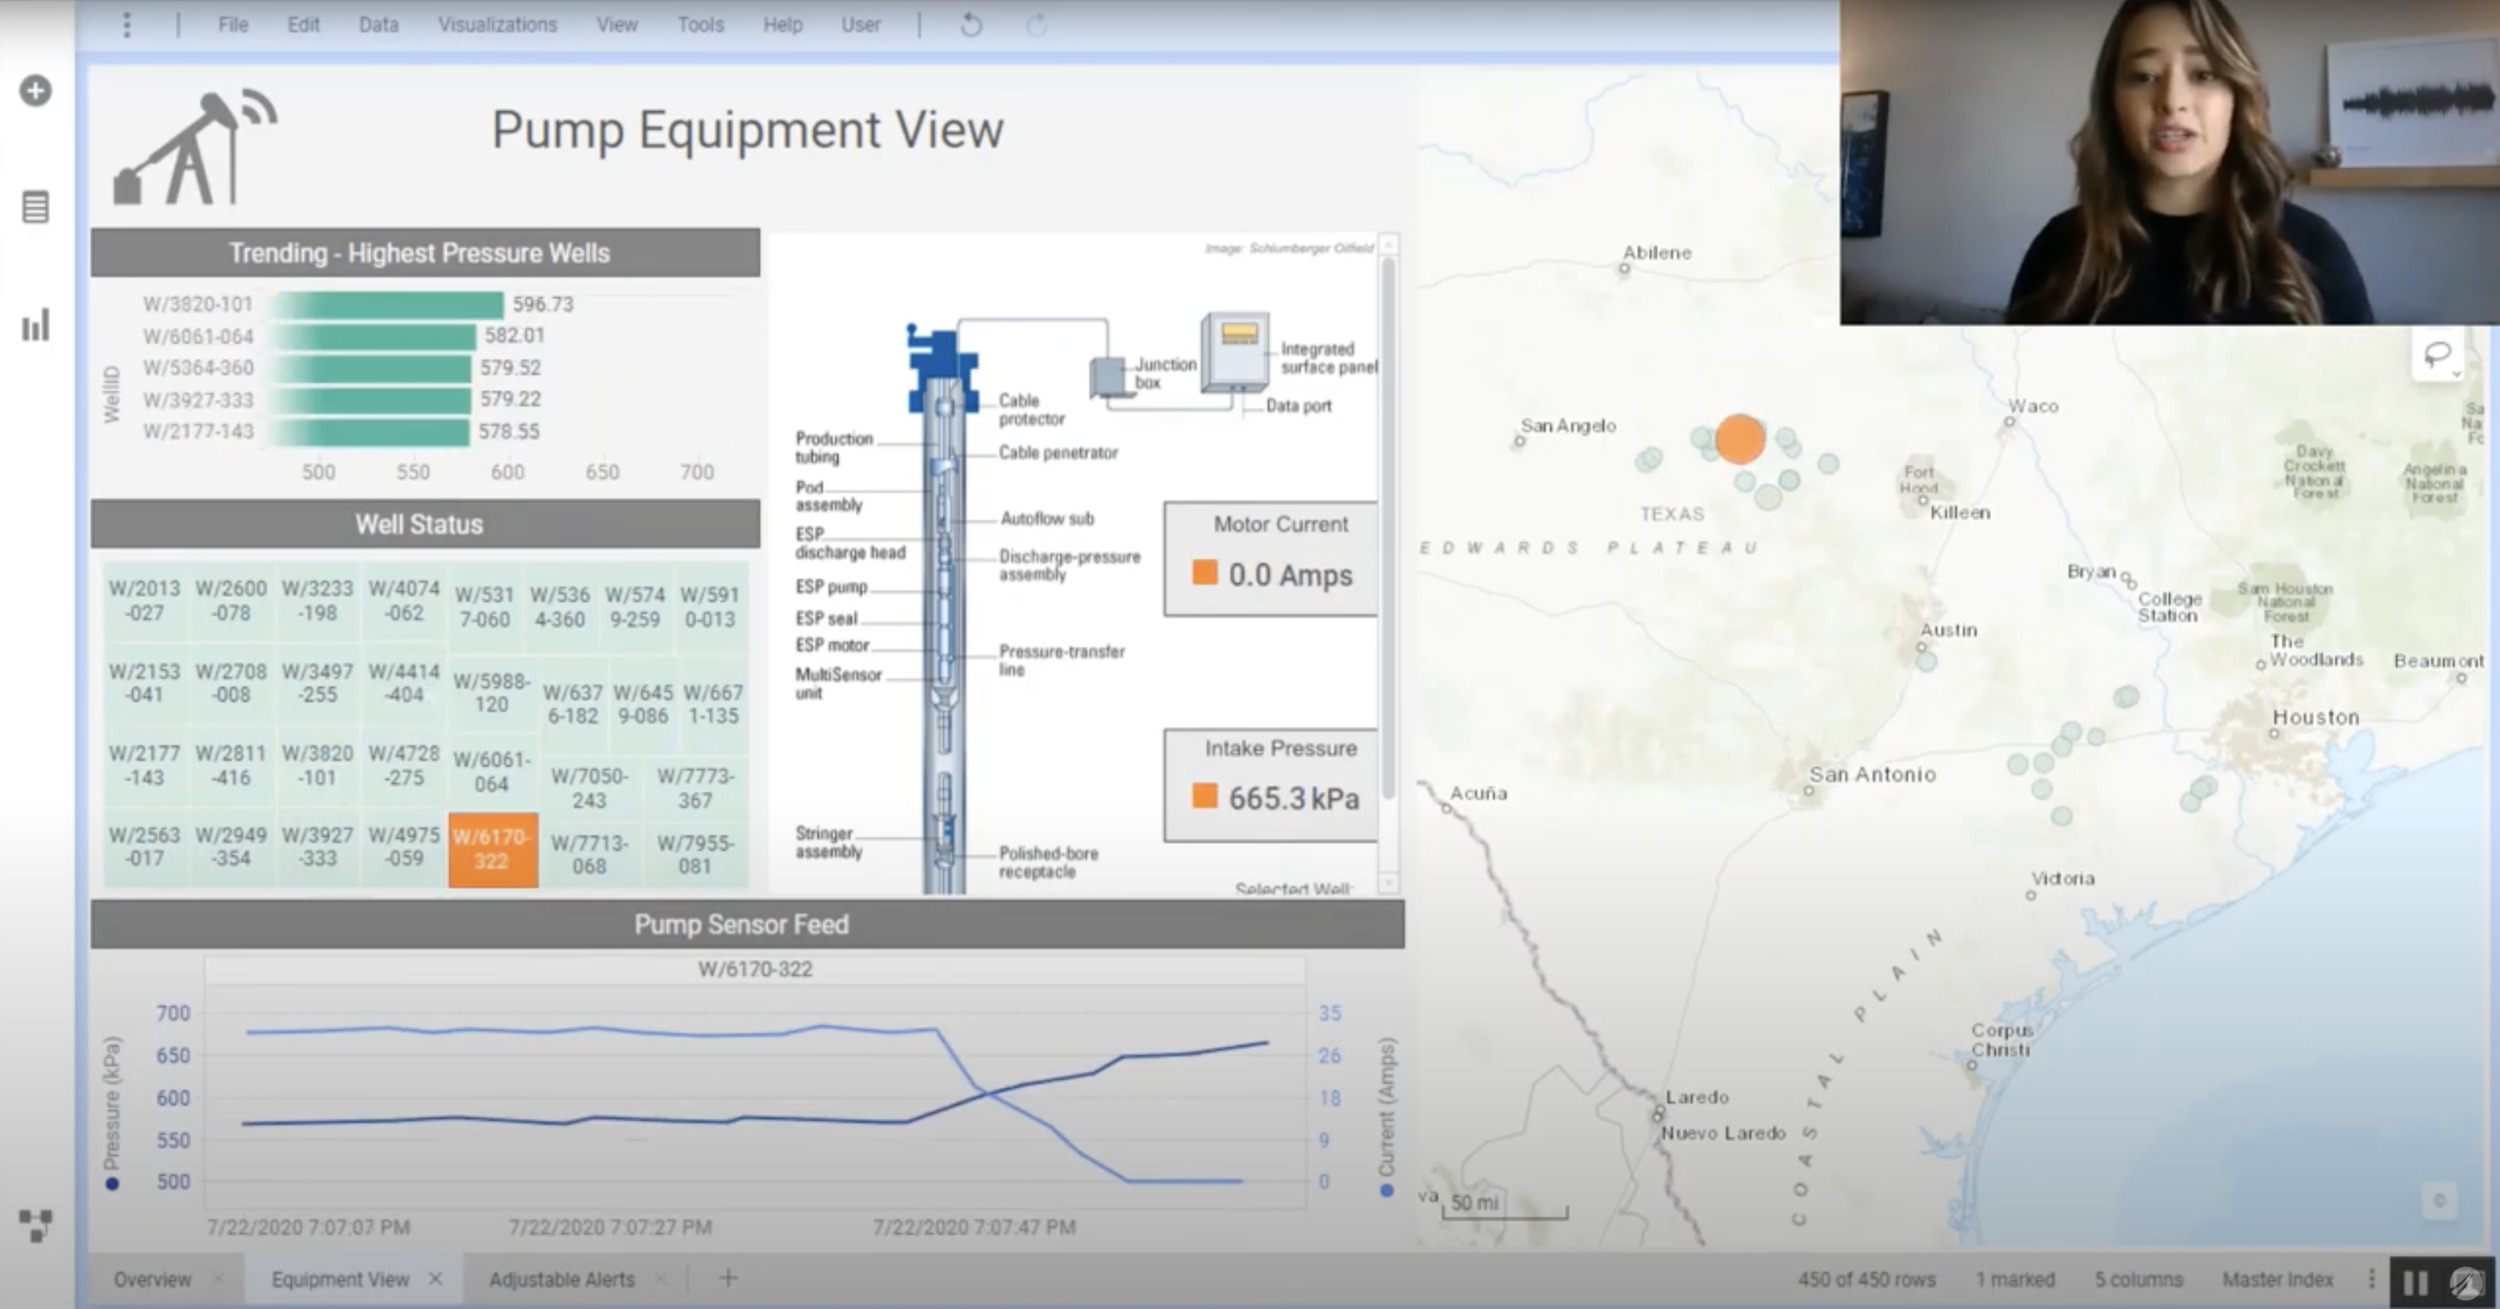
Visualizations like the wind-tunnel dashboard have been around for a while. The problem is, until now, they took staff-years to create. New self-service tools make it easy for anyone create them, like the video camera on your mobile phone. Watch it at work in this 4-minute video by Monica Cisneros.
Think Like a Movie Director
As in the dawn of videography, digital business leaders can think differently about digital data. But like anything new, it takes time to think of real-time questions and the new business possibilities they can reveal. Here’s how to think about it.
First, list the data you have that changes frequently. Want some inspiration? Here’s are 59 common sources of streaming data.
Next, think of questions that start with the words “tell me when.” Here are some examples:
Tell me when a high-value customer walks into any store with idle customer service reps
Tell me when a customer stops engaging with customer support after appearing upset.
Tell me when a piece of equipment shows signs of failure and has done so before.
Tell me when a plane is about to land with passengers that need help.
Tell me when an abnormal bank transaction happens.
For business analysts to pose these questions, data engineers connect streaming data to the streaming analytics engine. As the video above shows, this can take minutes, but high-speed streaming data should be carefully configured.
Next, let the exploration begin! Knowledge workers can use streaming data just like static data, except the data is live. Graphs move. Tables update.
A New “Compared to What” Dimension
Real-time isn’t just about real-time reaction and automation. It helps compare what’s happening with happened in the past. Analytical thinking pioneer Edward Tufte explains the central importance of comparison:
“To be truthful and revealing, data graphics must bear on the question at the heart of quantitative thinking: “Compared to what?” The emaciated, data-thin design should always provoke suspicion, for graphics often lie by omission, leaving out data sufficient for comparisons.
Streaming analytics provides a new dimension of analytical comparison: time. For example, in the wind-tunnel dashboard, colors are chosen by comparing if we’re doing better (in red) or worse (in green) now than in our previous fastest lap. The ability to compare the now to the past reveals a new dimension of comparison and a new dimension of thinking!
Welcome the Moving Data Analytics Era
Like still photography, visual analytics on data at rest is here to stay. But analytics on data in motion helps reveal what had been invisible. Continuous context helps knowledge workers put what’s happening now in perspective, in minutes. It helps them make new comparisons. Like videography in 1880, streaming analytics is in its infancy, and requires new thinking. But as all business becomes digital and more automated, real-time is now an essential new tool. So, welcome to the moving data analytics era.