
W.E.B. Du Bois, Data Science as Art
The word “revolutionary” is thrown around like darts at a bar. They stick to any good idea and some bad ones.
W.E.B. Dubois was one of the most important anti-racism activists in the history of the United States. As a data scientist, his graphic visualizations were revolutionary. The Smithsonian has even declared that Du Bois directly influenced the modernist art movement—Bauhaus, Cubism, and Russian Constructivism.
Jason Forrest, director of interactive data visualization for McKinsey and Company, decisively debunks this theory. Yet, the visual evidence is uncanny. Du Bois’ work pre-dates work by Modernists like Miro, Picasso, and László Moholy-Nagy by years.
So, although not a direct influence, it’s safe to say that Du Bois beat them to some of their best artistic punches!

It’s the fusion of art and data where the magic happens for me. One Du Bois creation, what Elijah Meeks calls the Du Bois Spiral, is a playful, elongated, artistic bar chart with attitude.
You view a Du Bois Spiral like a bar chart that’s too long for the page. Here, Du Bois twists it into a spiral to make it fit, only he’s not just making room, he’s showing scale. Du Bois shows African Americans’ economic advancement in Georgia based on the value of their furniture, from 1875 to 1899. In five-year increments, from $21,186 to $1,434,975 in 1899, the swirling red spiral delivers the message that African Americans are a growing economic force.

“Assessed value of household and kitchen furniture owned by Georgia Negroes.” Du Bois, W. E. B. (William Edward Burghardt), 1868-1963. The Library of Congress. This chart was chosen as the cover of W. E. B. Du Bois's Data Portraits: Visualizing Black America.
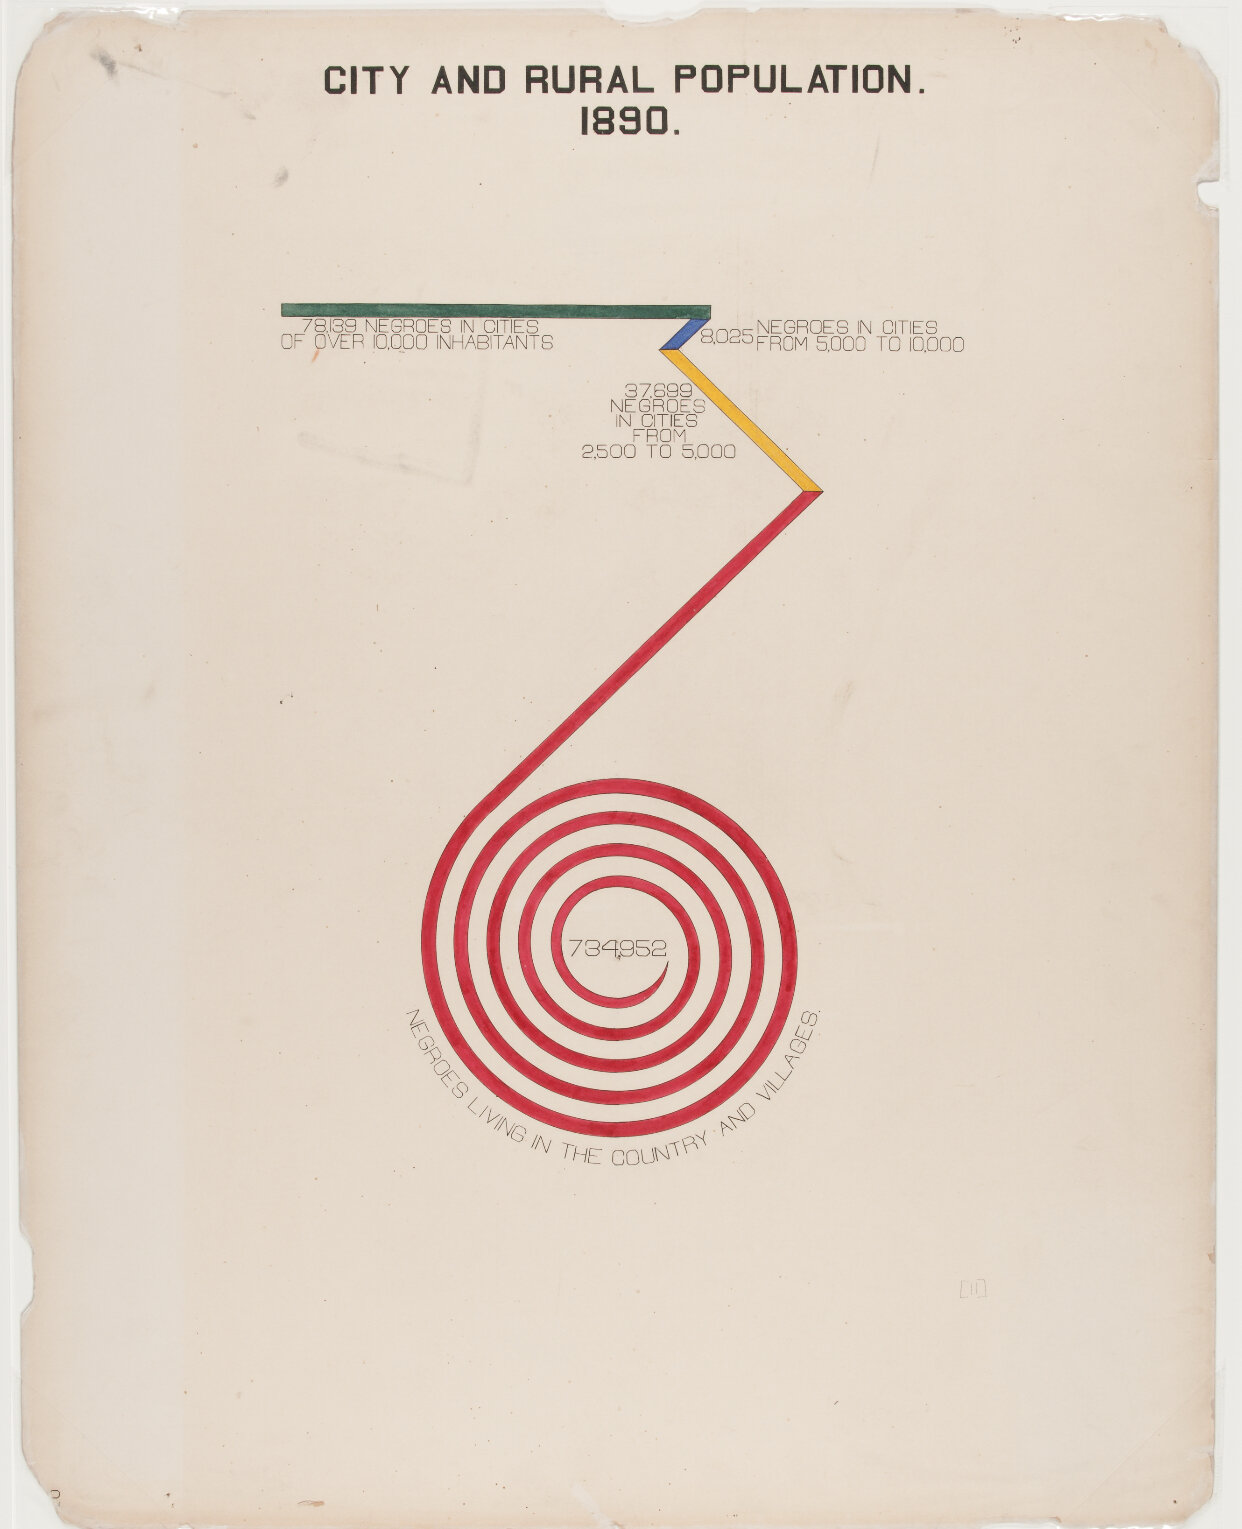
This lollypop-like spiral shows where African Americans lived in 1890. 734,952 were in less affluent rural areas, shown again in red. Combined, the other three lines in yellow, blue, and green show only 120,000 were living in cities. Economically, while other charts show profess, this one shows there’s a long way to go.
Where African Americans dominantly Catholic or Protestant? The Du Bois spiral leaves no doubt:

Courtesy of The Library of Congress.
This commentary emphasizes the dominance of industrial studies for the youth of Georgia.
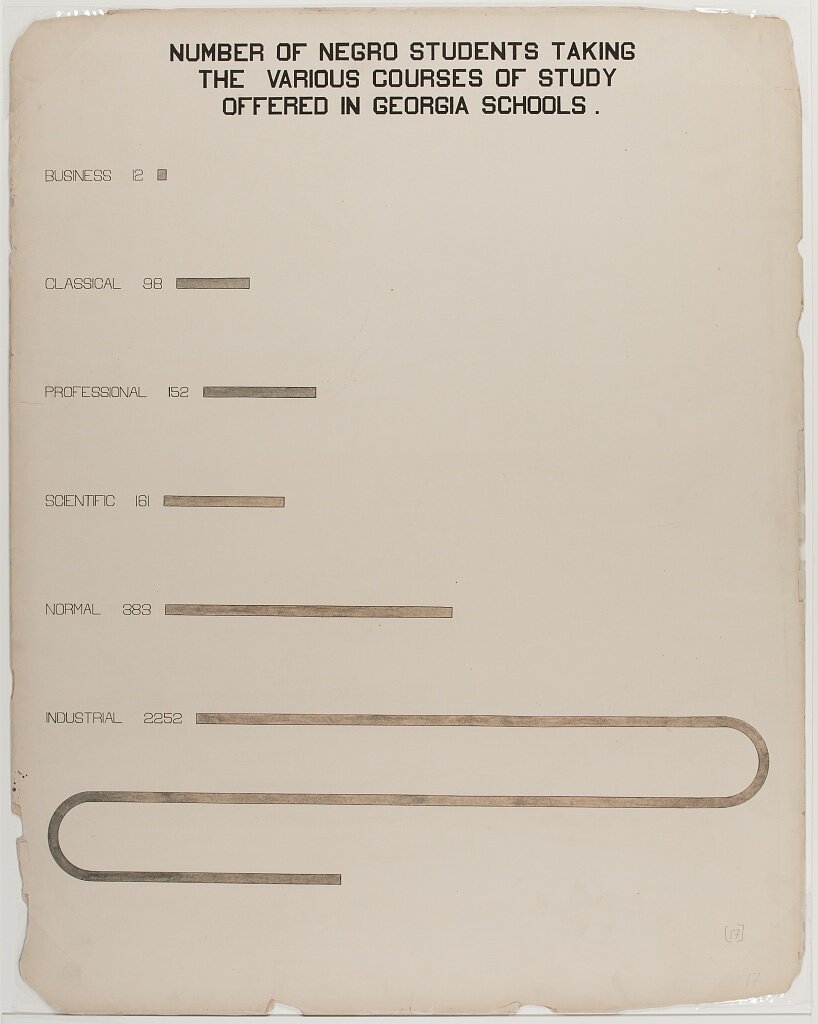
“The Number of Negro students taking the various courses of study offered in Georgia schools.” Courtesy of The Library of Congress.
The “Du Bois Spiral” is memorable, beautiful, and revolutionary. I’ll keep sharing my favorites here. Thanks, once again, to the Library of Congress, Jason Forrest, and W. E. B. Du Bois's Data Portraits: Visualizing Black America edited by Whitney Battle-Baptiste and Britt Rusert.


